Data Joins
From one shape to many
So far, we have seen a lot of examples of drawing single shapes, one at a time. For the personal homepage demonstration, we wrote separate svg.append() statements for each of the randomly positioned circles, lines, and squares; in the random circle drawing demonstration, we clicked a button, and a single circle appeared somewhere on the screen, one at a time. In all of these examples so far, there has been a strict one-to-one equivalency of shape to code: if we want to draw another new, distinct shape, we have to repeat the svg.append() pattern for each shape we draw.
This works alright when we have small numbers of shapes. But in many cases, we won’t have just a few shapes — we will have many. For example, imagine we had an SVG canvas that was 500 pixels wide and 500 pixels tall, and we wanted to draw 5 circles evenly spaced across the canvas. (How could we compute what the horizontal positions of the circles should be, based on the width of the SVG canvas and the number of circles we want to draw?) This number of circles is still small enough to justify repeating the svg.append() pattern 5 times and manually modifying the cx attribute of each individual circle, like this:
svg.append("circle")
    .attr("cx", 50)
    .attr("cy", 250)
    .attr("r", 20)
    .attr("fill", "red");

svg.append("circle")
    .attr("cx", 150)
    .attr("cy", 250)
    .attr("r", 20)
    .attr("fill", "red");

svg.append("circle")
    .attr("cx", 250)
    .attr("cy", 250)
    .attr("r", 20)
    .attr("fill", "red");

svg.append("circle")
    .attr("cx", 350)
    .attr("cy", 250)
    .attr("r", 20)
    .attr("fill", "red");

svg.append("circle")
    .attr("cx", 450)
    .attr("cy", 250)
    .attr("r", 20)
    .attr("fill", "red");
But now imagine another scenario: what if we wanted to draw 10 circles, evenly spaced across the SVG canvas? Perhaps this may still seem small enough to justify writing 10 svg.append() statements, and we could do the same thing as above and manually change each circle's cx attribute. But as we keep going upward, we quickly realize this is unsustainable. What if we want to draw 50 circles evenly spaced across the canvas? What about 100 circles? What if we want to place them diagonally across the canvas? What if those 100 circles each have random cx and cy attributes? Are we really going to write the same svg.append() pattern over and over and over again, and manually tweak the attributes of each individual circle?
No. This would be absurd! Fortunately, we have a pattern that can help us with this. That pattern is the for loop. JavaScript loops enable us to repeat an action over and over again, a finite number of times. If we combine loops with our shape-drawing pattern, we see that we can use a loop to draw 10, 50, 100, or 1000 or more shapes on the SVG canvas, while only needing to write the svg.append() pattern once inside the loop. For example, examine the following code:
let numberCircles = 10;
for(let i = 1; i <= numberCircles; i++) {
    svg.append("circle")
        .attr("cx", (i/numberCircles) * (width - 20))
        .attr("cy", height/2)
        .attr("r", 10)
        .attr("fill", "#CC0000");
}
The code above produces the following output:
In this example, we are using a for loop to count from 1 up through whatever the value of numberCircles is; the numberCircles variable is being used to control how many circles we want to draw. Inside the loop, we are using the svg.append() pattern to draw a new circle, at a new location on the SVG canvas, every time the loop iterates. Since this loop will run a total of 10 times, and since each time the loop runs a new circle is drawn, in the end we will have 10 circles drawn on the canvas — but with only needing to write the svg.append() pattern once. (Note the calculation for the cx attribute of the circles: Do you understand what’s happening here? We are using the value of the iterator, i, to partition the width of the SVG canvas into equally-sized distances, based on the number of circles we are drawing. The expression i/numberCircles will give a decimal value between 0 and 1, and when we multiply this by the width of the canvas, we place each drawn circle at an equally-spaced increment across the canvas. The width-20 expression is an adjustment to ensure the last circle, which gets positioned at cx = width, doesn't get cut off by the edge of the canvas.)
This procedure extrapolates to any other shape. If we wanted to draw 50 squares nested inside of each other, we could do something like this:
let numberSquares = 50;
let squareSizeFactor = 10;
for(let i = 1; i <= numberSquares; i++) {
    let squareSize = i * squareSizeFactor;
    svg.append("rect")
        .attr("width", squareSize)
        .attr("height", squareSize)
        .attr("x", width/2 - squareSize/2)
        .attr("y", height/2 - squareSize/2)
        .attr("fill", "none")
        .attr("stroke", "#CC0000")
        .attr("stroke-width",1);
}
As before, examine the code above and see if you can understand the mathematical logic behind how the loop itself is being used to iteratively change the size of the rectangles being drawn. This code produces the following output:
This example is a few steps more complex, but the basic idea is the same. We are running a loop a fixed number of times; every time the loop runs, we are drawing a square with a different size; in the end, we will have drawn a fixed number of squares based on the number of times the loop runs, while only needing to write the svg.append() pattern once.
With this pattern, our code is now much more sustainable and scalable. If we want to change the number of shapes we draw, we only need to modify the settings of the loop. If we want to change the arrangement of shapes on the SVG canvas, we only need to modify what happens inside the loop. This unlocks an infinite range of new possibilities.
But sometimes, this won’t be enough. Even though this construction gives us the flexibility to draw many shapes at once, there are still some limitations to it. First, the construction is highly mechanical; we have taken two independently different patterns — loops and shape-drawing — and mashed them together, and the number of shapes drawn, along with their attributes, is fixed and constrained based on the “settings” we supply for the loop and shapes. Second, as a consequence of the highly mechanical nature of the construction, we are constrained to working with certain discrete possibilities of shape attributes — namely, incrementally modifying the newly-drawn shapes’ position attributes in geometric and scaled ways. What if we wanted to draw 100 circles and have their positions determined by a set of data that we’ve defined, rather than geometrically and linearly scalable increments of values? What if we wanted to draw 500 circles and have each circle be created with its own unique attributes, without having to repeat the svg.append() pattern over and over again?
The D3 library recognizes that there are some limitations to the loop-shape construction that can get in the way of doing more complex things with shapes. In response, D3 has a mechanism that is called the data join, and this pattern motivates the whole reason behind the library’s existence.
Unpacking the data join pattern
The data join pattern allows us to take a data set, stored as an array of values, and link (or join) those data directly to the drawing of new elements in the DOM. While the loop-shape construction can join “data” to shapes from the outside in (controlled by the loop), the data join pattern seeks to do the inverse, joining data to shapes from the inside out. In the process, data get literally attached to new DOM elements as new properties that belong to those elements, and as a result, regardless of where the elements go, and regardless of how we might manipulate those elements, the data attached to them go with them.
Data joins in D3 require two key ingredients: an array of data, and the data join pattern. An array of data might look like this:
const data = [100, 250, 400];
And the data join pattern might look like this:
svg.selectAll("circle")
    .data(data)
    .enter()
    .append("circle");
These 4 lines of code are the core of the data join pattern. Let’s unpack each line one at a time — although the code is simple, there’s a lot going on here.
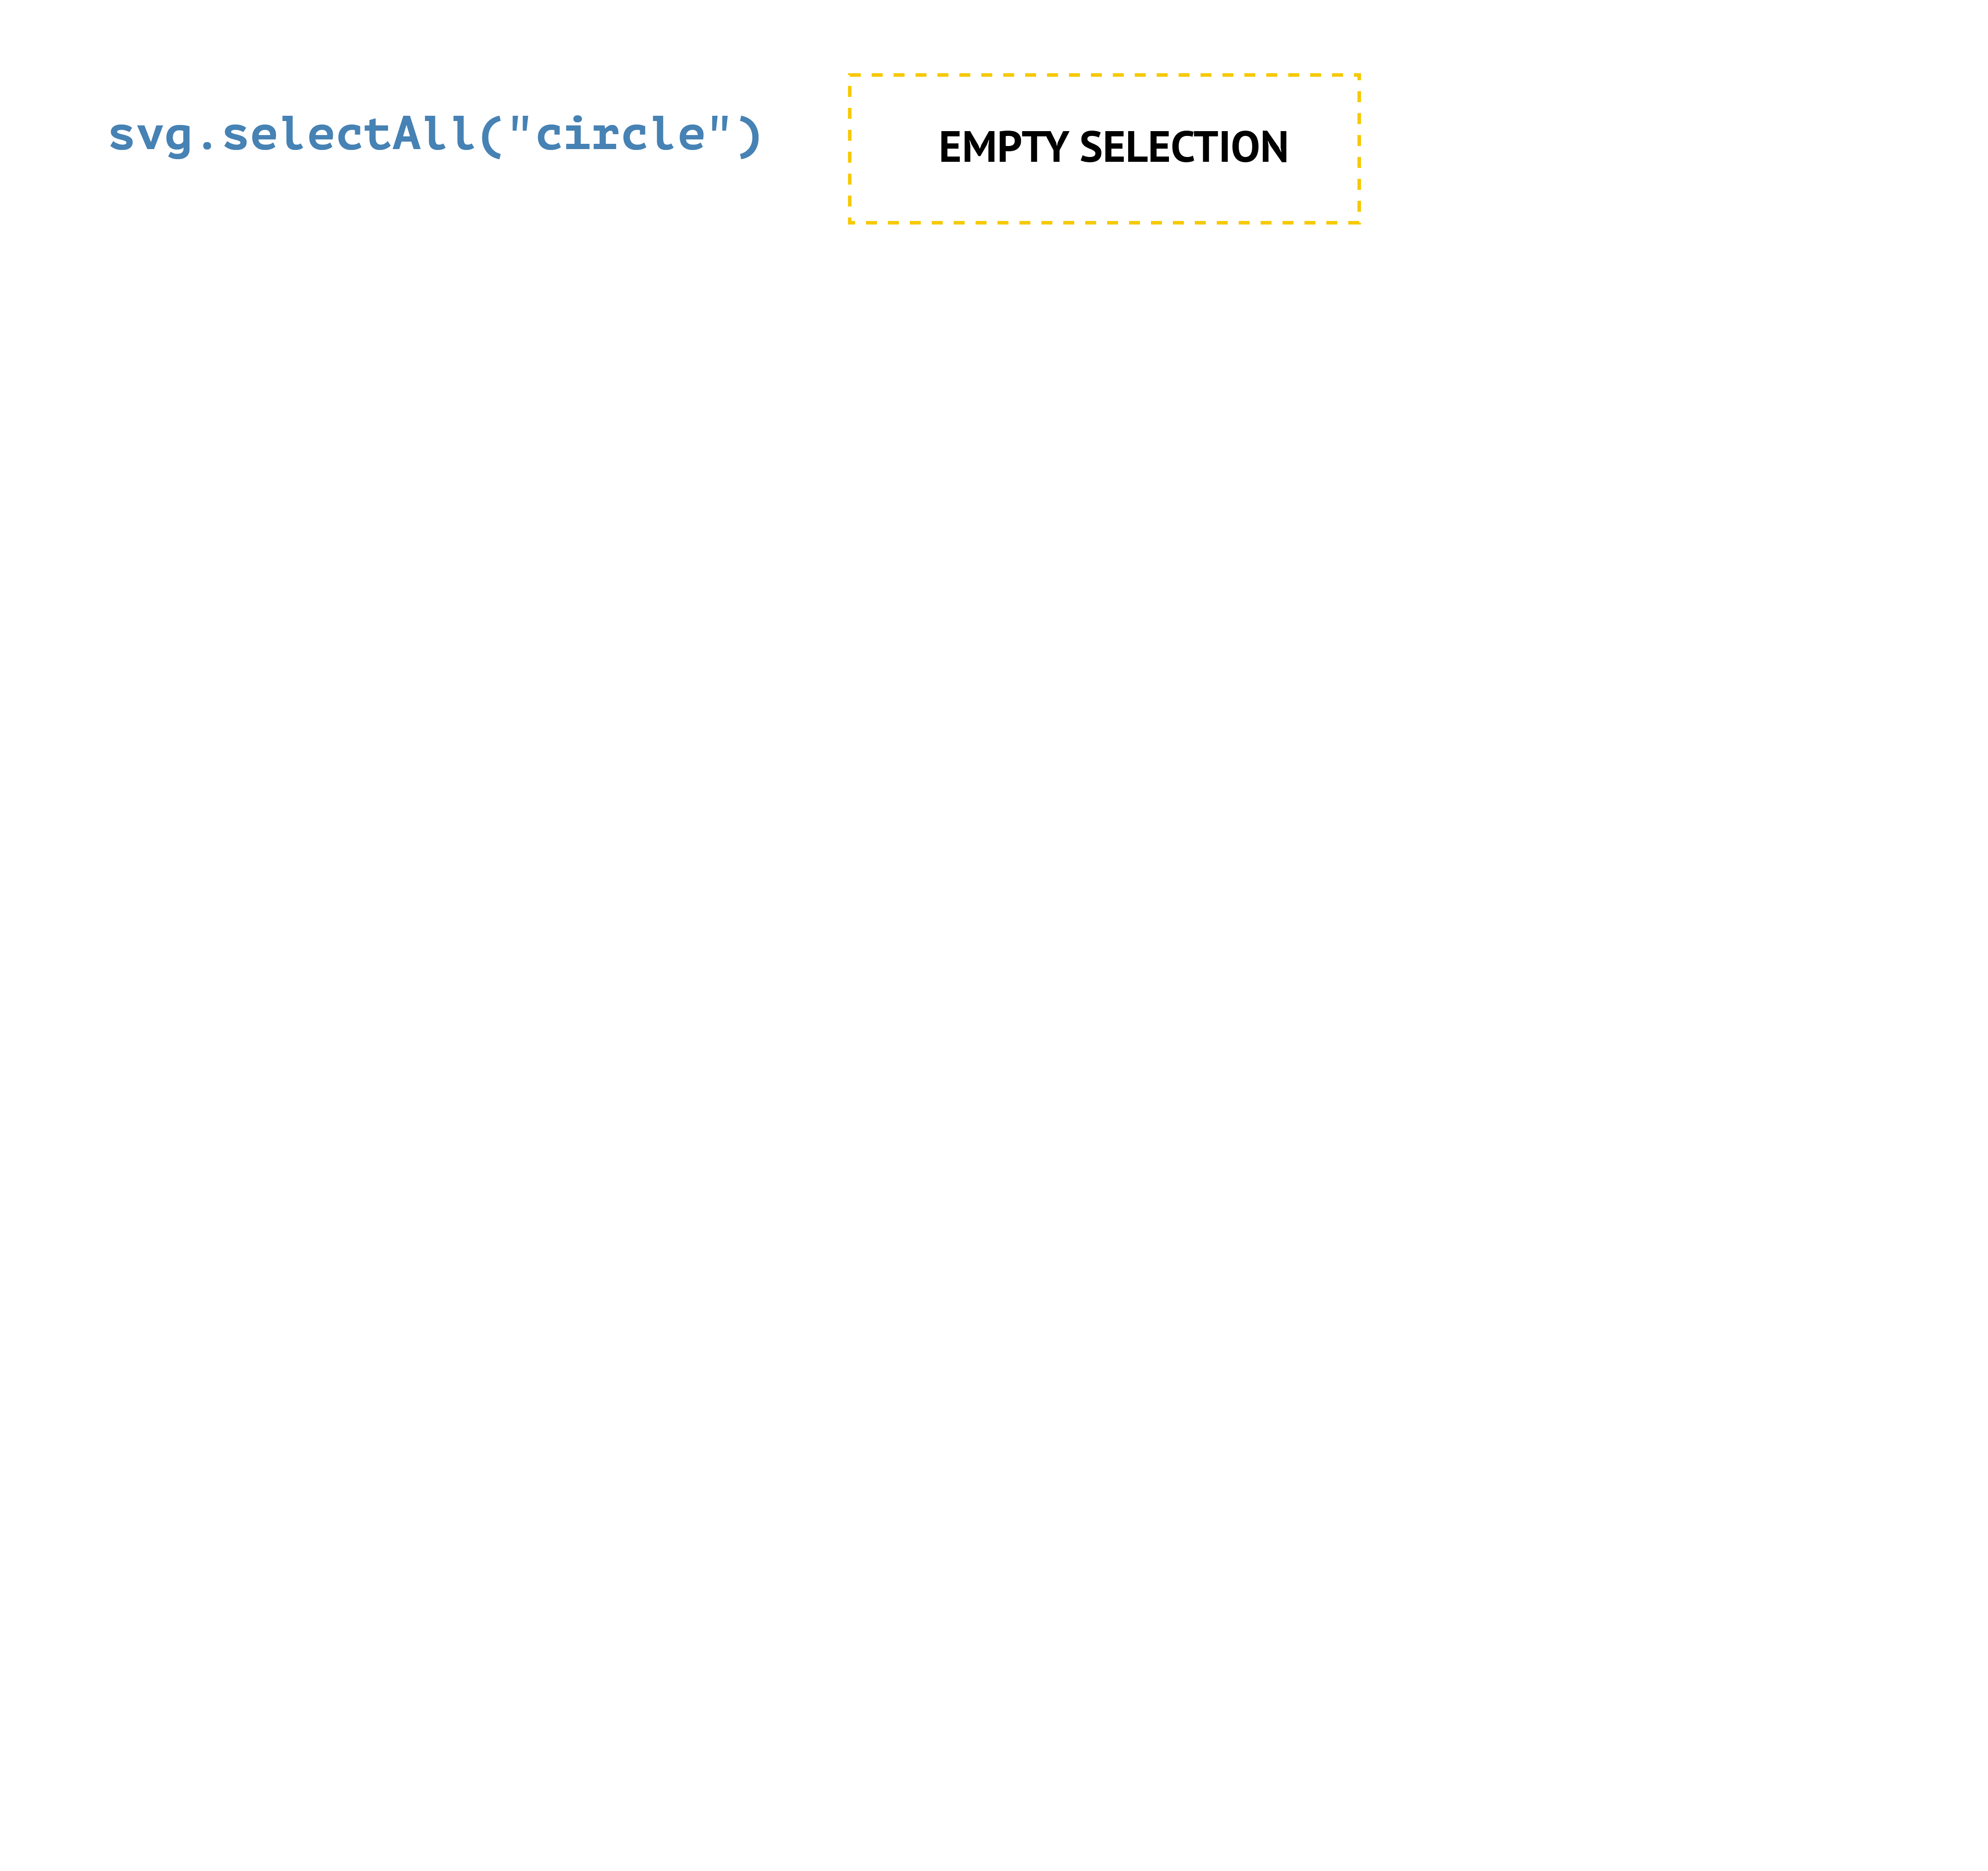
Making a selection: svg.selectAll("circle")
The first step in the data join pattern is to grab a selection of elements in the DOM. In this example here, we are using this line of code to select all elements with tag name “circle” that exist inside the SVG canvas. (As with past demonstrations, we are assuming that the variable named svg here stores a reference to an SVG canvas we have drawn with the help of D3 earlier in the code.)
This line of code might seem innocuous, but there’s actually something very strange going on here! Most of the time, this will return an empty selection: there are no circles in the SVG (because we very likely haven’t drawn any yet), and so this line of code doesn’t grab anything. Very mysterious! Why would we intentionally make a selection that is empty?
Binding data: .data(data)
The answer to this question lies in the line that follows. The svg.selectAll("circle") pattern still returns something, namely a selection that is empty. (It’s sort of like someone giving you an empty box; the box itself has no contents, but the box is still a container that you can physically hold.) This thing that is returned then gets passed into the next line, .data(), as the input. This particular .data() method takes that selection returned by the previous line and joins it, or attaches it, to the array of values we supply inside the parentheses of .data(). In this example, that array is stored in a variable we've named data (note that the name of the array itself coincidentally is the same name as the method we are using, but this is not required!), and the array holds 3 values (100, 250, 400). After this line is done, we now have an array of data joined to an empty selection of elements (i.e., circles).
Creating placeholders: .enter()
This joined selection then gets passed into the next line: the .enter() method. Notice that there is nothing inside the parentheses here! There’s nothing special we need to do here except invoke it by itself. This method takes that joined selection, and notices that while there are many different values in the array of data, there aren’t any elements in the selection. In other words, there are more values in the array than there are elements in the selection. The data join pattern makes the assumption that for every drawn shape, there will be exactly one datum attached to it, and so it is the .enter() method’s job to reconcile this difference. In this case, this method will create a new placeholder in the DOM for every value in the array of data that does not have a corresponding element attached to it. If there are 3 values in the array, the .enter() method needs to create 3 empty placeholders in the DOM; if there are 100 values in the array, the .enter() method needs to create 100 empty placeholders in the DOM. In the end, the requirement is that every value in the array of data must have some kind of placeholder or element joined with it.
Appending shapes: .append("circle")
The .enter() method returns a selection of placeholders bound to individual data. Finally, this returned selection is passed into the .append("circle") line, which performs the last step: we take each placeholder, created by the .enter() method, and append, or insert, a new element with tag name “circle” into it.
If we look at the SVG canvas at this point, we will notice that we don’t see anything. Where are our circles? They’re there. We can confirm this if we open up the inspector; inside the SVG canvas, we will see that there are 3 new <circle></circle> elements! They just don’t have any attributes defined yet. One new <circle> element has been created for each value in the array of data. If our array had 20 values inside of it, we would see 20 new circles drawn here.
But these aren’t just any other circle — they have data bound to them. We can confirm this by inspecting their properties. In the inspector, we can choose one of the circles to examine more closely. (It doesn’t matter which one.) If we click on that <circle> element in the inspector, and then click on the Properties tab, we can see a list of properties that belong to the element we have clicked. If we scroll all the way down to the bottom of the list, and look for a property named ___data___, we will see that it looks familiar. This is the exact same value as one of the values in our array named data. If we repeat this process for the other two circles, we will find they all have different values for this property.
Giving our new circles some attributes
So now we have some <circle> elements, but they don’t appear in the browser window as real circles in the SVG canvas because they don’t have any attributes yet. In order to give these circles some attributes, we need to extend the data join pattern from above.
Recall that to change the attribute of a single shape drawn with D3, we use the shape.attr() pattern. When working with data joins, we use the exact same pattern here to apply attributes for these newly-drawn circles, but there’s a twist: in this context, the .attr() method defines attributes iteratively for all shapes drawn by the data join pattern. Consider the following:
svg.selectAll("circle")
    .data(data)
    .enter()
    .append("circle")
        .attr("cx", width/2)
        .attr("cy", height/2)
        .attr("fill", "#CC0000")
        .attr("r", 20);
Our circles now have attributes defined and appear on the screen. But they all have the exact same attributes, meaning they layer on top of one another! This gives the visual impression that only one circle has been drawn, but you can confirm for yourself that there are actually 3 different circles. Open the web inspector (right now) and inspect the following element in Chrome to find the circles inside the canvas; they all have the exact same attributes.
Typically, when we draw new shapes with the assistance of an array of data, we will want to use the values in that data set to control something about the visual attributes of the shapes we are drawing. For example, maybe we want to use those values in the array to control the cx attribute of some circles, or something about their sizes. Fortunately, when we perform a data join, we can directly access the values that are bound to the new shapes we will have drawn. We do this through the assistance of things called accessor functions.
An accessor function is simply a function expression that allows us to reach inside any new element we have created with a data join, grab a specific value bound to those elements, and then do something with them, typically to transform and use them to define attributes of those elements. In our example above, let’s use the values in the data array to control the cx attribute of our 3 circles. Specifically, we will set the cx attribute of the first circle to be 100, the cx of the second circle to be 250, and the cx of the third circle to be 400. (These are the 3 values stored in our array named data.)
In our pattern for drawing shapes one by one, we would do something like this:
svg.append("circle")
    .attr("cx", 100)
    .attr("cy", height/2)
    .attr("r", 20)
    .attr("fill", "#CC0000");

svg.append("circle")
    .attr("cx", 250)
    .attr("cy", height/2)
    .attr("r", 20)
    .attr("fill", "#CC0000");

svg.append("circle")
    .attr("cx", 400)
    .attr("cy", height/2)
    .attr("r", 20)
    .attr("fill", "#CC0000");
But we are working with the data join pattern here, not individual shapes. Instead, with the data join, we can call the .attr() method with “cx” as the first argument, but instead of passing in an explicit and literal value for the second argument, we can pass in a function expression, like this:
svg.selectAll("circle")
    .data(data)
    .enter()
    .append("circle")
        .attr("cx", function(d) { return d; });
Notice how the second argument of the .attr() method isn’t a value — it’s a function. In this context, we’ll call this an accessor function, because it will give us access to the data bound to each shape we’ve drawn. The parameter we’ve named d here will be equal to whatever value is bound to each drawn circle; for the first circle, it will be 100, for the second it will be 250, and for the third it will be 400. (Here, the name d is arbitrary, and we could name it anything else, but d is conventional in D3 examples.) Inside the body of the accessor function, we can refer back to this thing called d as a locally scoped variable. In this particular example, we are taking that value and spitting it back out of the function, with the return statement. When we spit this value back out of the accessor function, we can then assign that as the value of the attribute named in the first argument of the .attr() method. In this case, that attribute is “cx” — and the end result is that the cx attribute of each of the 3 circles will be something different, depending on which value has been bound to it.
If we then want all the circles to have the same values for all the other required attributes, we can just invoke the .attr() method like normal, passing in explicit literal values for the other attributes.
svg.selectAll("circle")
    .data(data)
    .enter()
    .append("circle")
        .attr("cx", function(d) { return d; })
        .attr("cy", height/2)
        .attr("r", 20)
        .attr("fill", "#CC0000");
This produces the following result:
After all of this, we will have 3 circles, each vertically centered with a radius of 20 and a fill color of red, but with different horizontal positions across the SVG canvas. As before, open up the web inspector in Chrome and inspect these circles yourself; their cx attributes will be the values from the array of data we joined to them.
Generalizing the pattern
This procedure generalizes in three ways. First, we can have any number of values in our array; in our example here, we have 3 values, but if we had 20 values, or 500 values, we’d have a correspondingly different number of created elements to match. Second, we aren't limited to drawing new circles with a data join; we can use the pattern to create rectangles, lines, and even any kind of valid element in the DOM (including p elements, div elements, and beyond!). For example, if we wanted to use the same data set to draw 3 squares, we could use the following pattern:
svg.selectAll("rect")
    .data(data)
    .enter()
    .append("rect")
        .attr("x", function(d) { return d; })
        .attr("y", height/2)
        .attr("width", 50)
        .attr("height", 50)
        .attr("fill", "#CC0000");
(Remember, we draw rectangles from the top left corner; how might we modify the code above to center each drawn square at the points in the data set, as opposed to positioning their top-left corners at those points?) This produces the following result:
As a third point of generalization, the array we join to our selection of elements doesn’t have to be simply an array of individual values — we can use an array of objects, and bind each object of data to each newly drawn element.
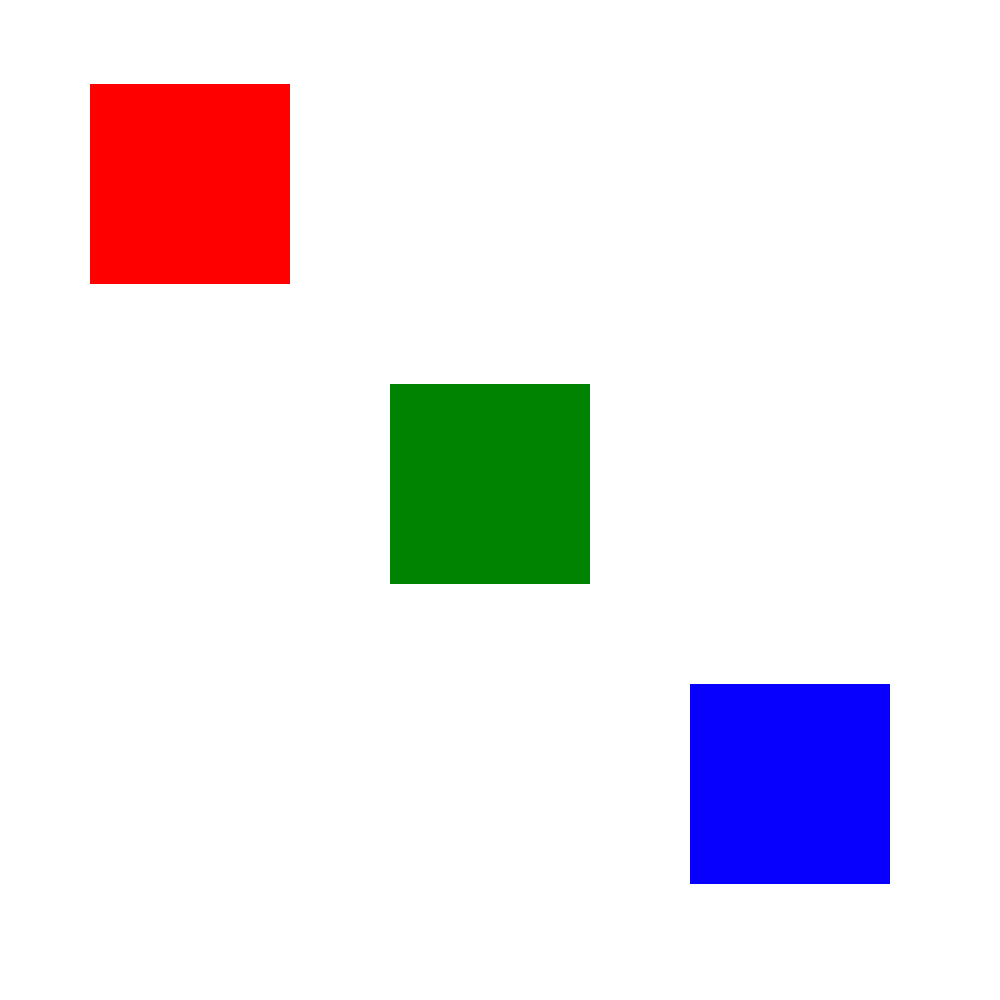
Consider the following data set:
const data = [
    {x: 100, y: 100, color: "red"},
    {x: 250, y: 250, color: "green"},
    {x: 400, y: 400, color: "blue"}
];
Let’s say we wanted to use this data set to draw 3 new circles, and have the positions and colors of those new circles be based directly on the values in the objects in this array. If we follow the data join pattern, just like before, we will see that now each new element has an entire object of values attached to itself, not just individual values:
svg.selectAll("circle")
    .data(data)
    .enter()
    .append("circle");
Then, if we wanted to set the cx attribute of these circles to be based on the property named x inside each of the objects in the array, we could use an accessor function like before:
svg.selectAll("circle")
    .data(data)
    .enter()
    .append("circle")
        .attr("cx", function(d) { return d.x; });
Notice the return d.x part inside the accessor function. In this example, the value of d for each circle is now an object, not an individual value. As a result, we can access the values of properties inside those objects using standard object dot notation. In this case, d.x grabs whatever the value of the property named ‘x’ is inside those individual objects; this value gets returned by the accessor function and spit back out to define the cx attribute of the 3 circles as different values.
If we wanted to use the value of the property named ‘y’ as the cy attribute, and the value of the property named ‘color’ as the fill attribute, we can use additional accessor functions for each attribute:
svg.selectAll("circle")
    .data(data)
    .enter()
    .append("circle")
        .attr("cx", function(d) { return d.x; })
        .attr("cy", function(d) { return d.y; })
        .attr("fill", function(d) { return d.color; })
        .attr("r", 50);
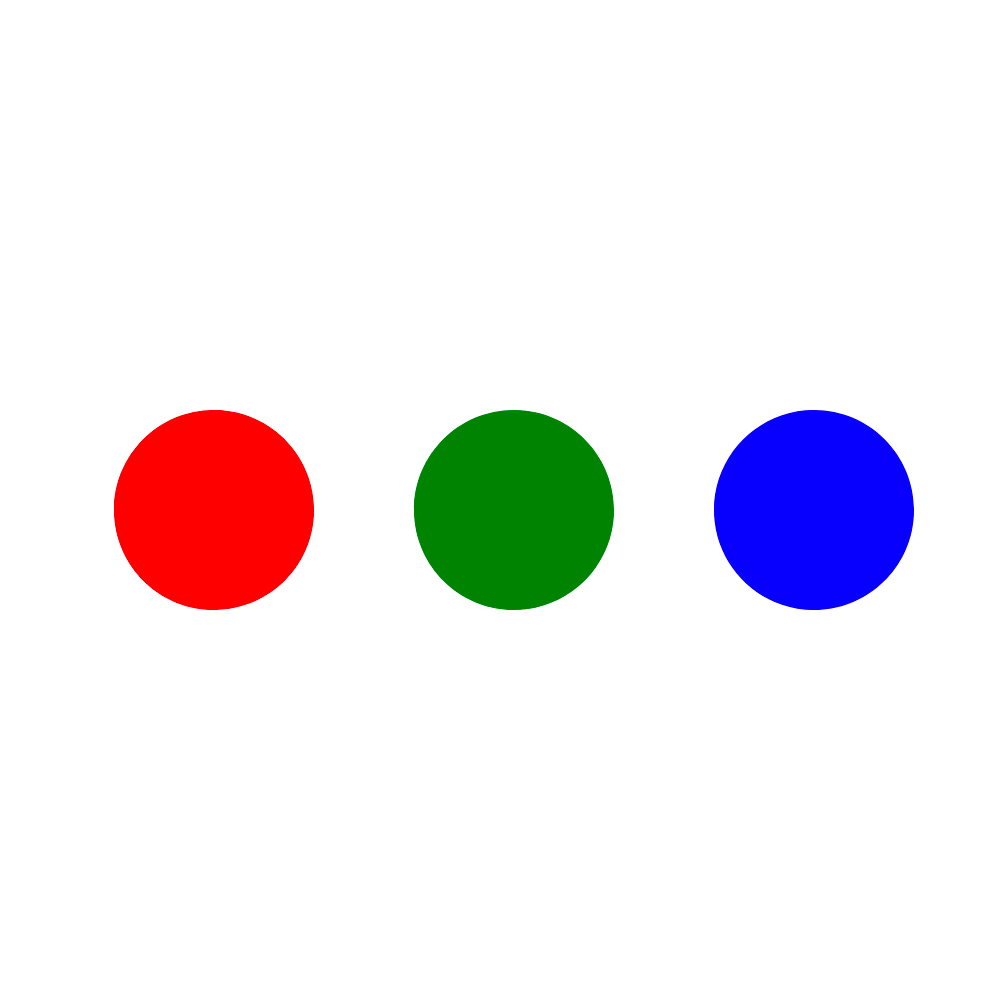
This slightly more complex example produces the following result:
We now have 3 attributes for each circle being dynamically computed based on a data set. Note that each accessor function follows the same function(d) { … } pattern; in each pattern, the parameter named d is locally scoped and only exists within the specific accessor function in which it is invoked. Although the value of d will be a reference to the same thing in each of those 3 lines — i.e., the value will be the object bound to each individual shape — the name d will be isolated in existence in those same 3 lines. In other words, we can reuse the name d in each accessor function without worrying that there will be a variable naming conflict.
If we modify the values in the data set, and then recompute the data join, we will see that the changes in the data propagate automatically to the attributes:
const data = [
    {x: 250, y: 100, color: "red"},
    {x: 250, y: 250, color: "green"},
    {x: 250, y: 400, color: "blue"}
];

svg.selectAll("circle")
    .data(data)
    .enter()
    .append("circle")
        .attr("cx", function(d) { return d.x; })
        .attr("cy", function(d) { return d.y; })
        .attr("fill", function(d) { return d.color; })
        .attr("r", 50);
The data set has changed slightly (notice the different values of the x property in each object), but the data join pattern is exactly the same.
This is the whole purpose and motivation of D3. D3 stands for “data-driven documents,” and the “data-driven” part means that our elements in the DOM have data literally bound to them. This pattern opens up an enormous range of possibilities in many contexts, including data visualization, modeling of physics simulations, and creating interactive applications like real-time drawing systems. In the next unit, we’ll focus on its use in one application in particular: DOM manipulation.
Exploration and practice
Take a moment to review the data join pattern and the conceptual architecture behind it, and inspect the examples above (with the Chrome inspector) to confirm that the data joins are yielding the expected DOM elements. Then, proceed with the following exercises.
Examine the template document provided. This template demonstrates a simple data join, based on the examples above. If you open the document in your web browser, you will see that it draws 3 circles, each with different colors and positions inside the SVG canvas.
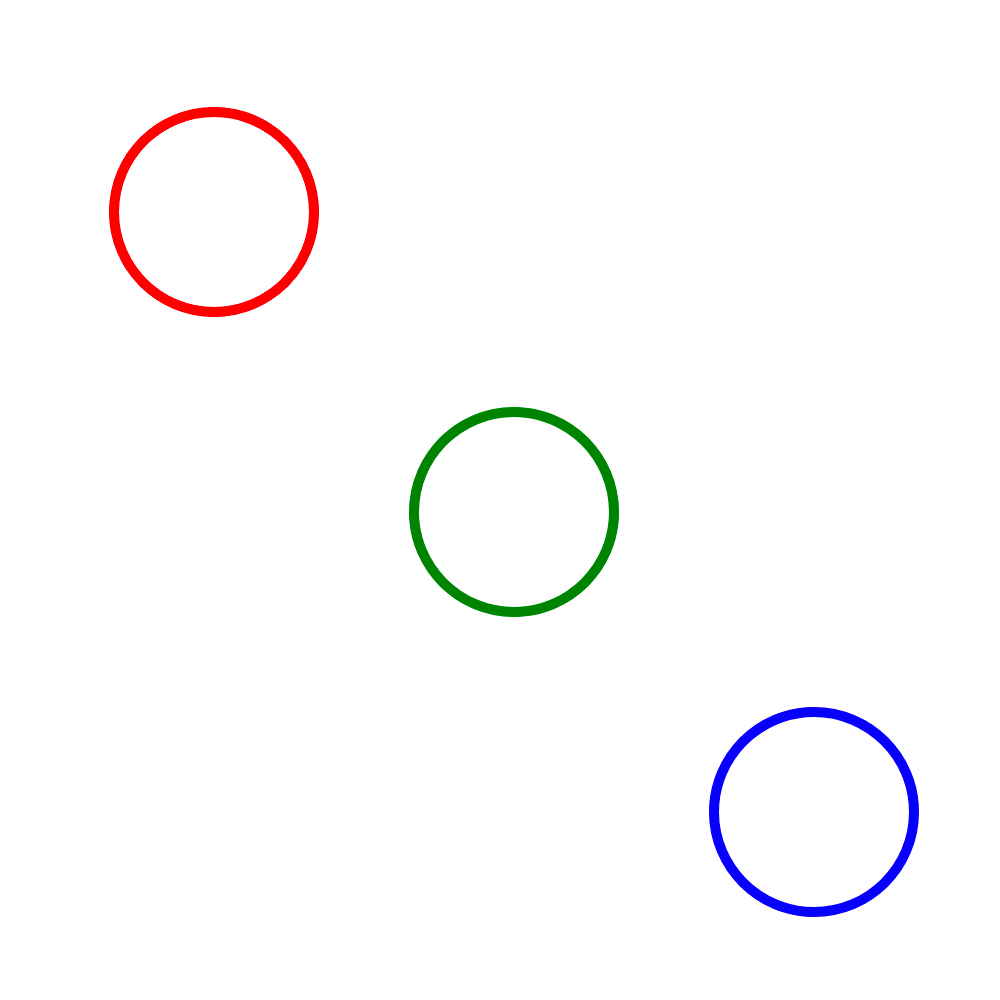
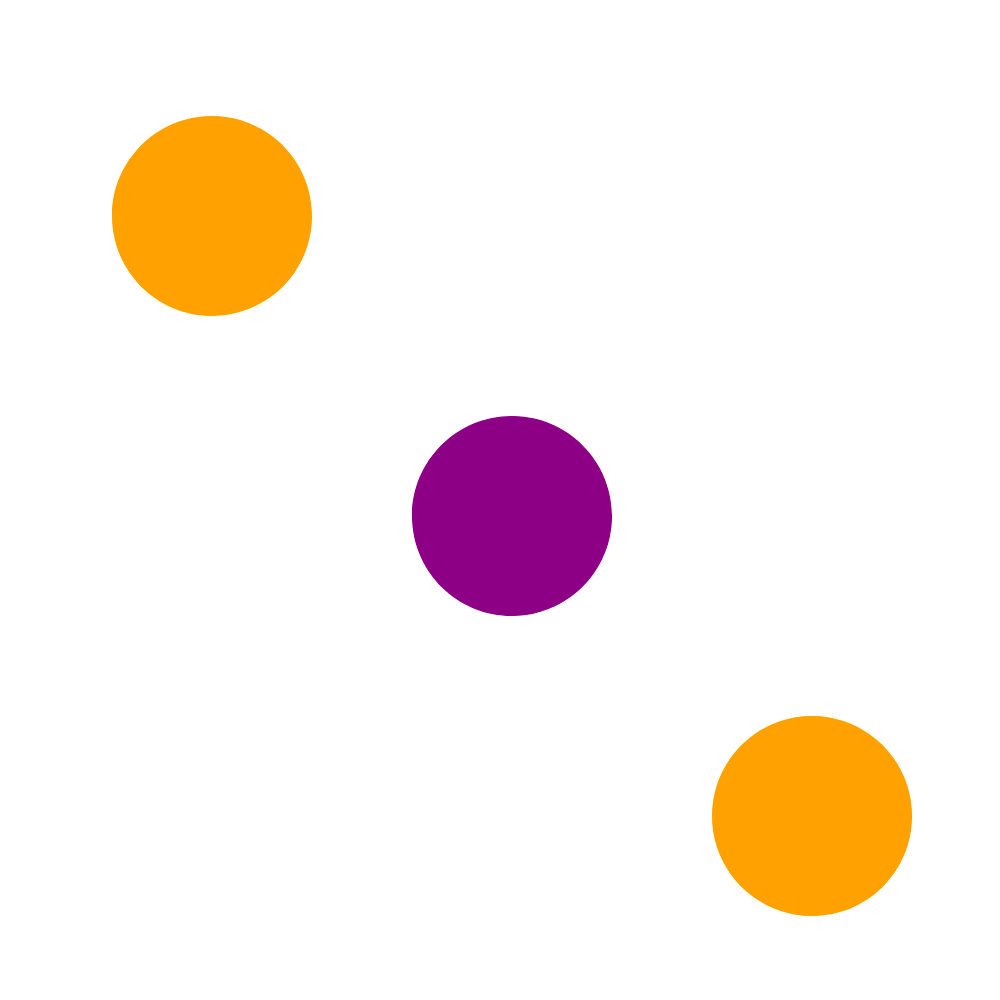
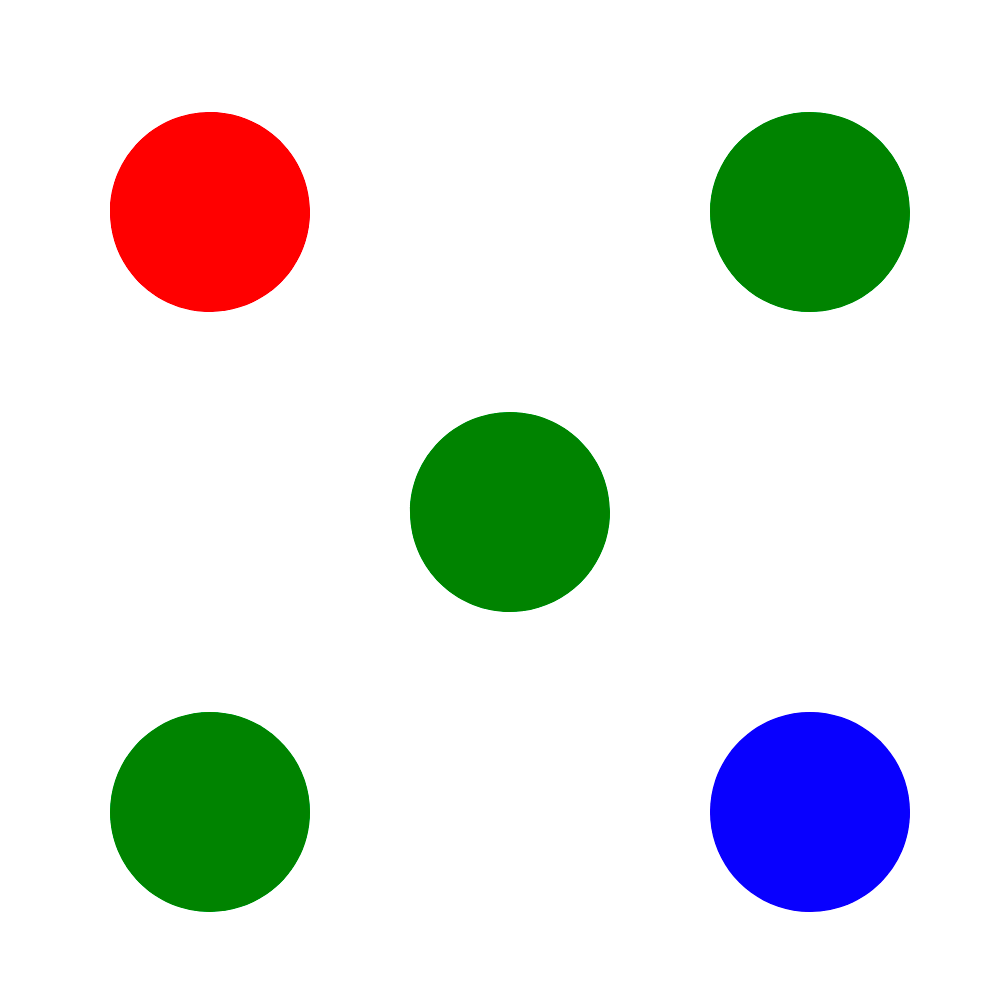
Then, examine each of the following images. They all show different visual outcomes of the template file you've been provided, with small modifications to the code. How would you need to modify the code in the template file to achieve each of the following visual outputs? The outputs themselves are not cumulative; determine how the original template code needs to be modified to achieve each outcome, make those modifications, and then revert the template back to its original form before proceeding to the next challenge. Hint: in each of the following, you either only need to modify something about the data or something about the code in the data join pattern (using the .attr() method calls; you shouldn't need to modify the data and the data join code at the same time together).