Introduction to SVG and D3
Let's draw!
Up until this point, we have focused our attention on the content and visual appearance of documents on the web. Through learning the fundamentals of HTML and CSS, we’ve encountered the philosophy of separating content from style, seeing that there are different web technologies that allow us to produce complex interactions between the code we write and how content gets rendered by the browser. We’ve seen that we can do a lot with just HTML and CSS alone to produce any infinite number of possible arrangements of different types of content and how they are visually styled.
HTML and CSS will get us far, but eventually we will want to do more. We will want to turn our documents into interactive web pages that invite, engage, and inspire the curiosity of the user. In this unit, we will get our first exposure to the technologies that will make this possible for us: JavaScript and D3.js. Through the help of new languages and patterns of code, we will be able to turn our static web pages into creative applications, like clickable task lists, MadLib generators, visualizations of data, and more.
Perhaps most importantly, we will be able to turn our flat documents into canvases for drawing shapes, either through our own imagination or via interactivity from the user’s mouse. This, then, is where we will start our journey into the rest of our semester: Let’s draw!
Drawing with LEGO blocks
Regardless of the medium – pencil, marker, paint, chalk – drawing is a universally understood form of creative making. But “drawing” isn’t limited to pencil on paper; after all, we can make pictures of people, places, and things through other unexpected media like sculpted cakes, Perler beads that we melt together with an iron, or even an Etch A Sketch. With this logic, let's then extend our understanding of drawing to one other unexpected place in particular: building things with LEGO blocks.
Perhaps most of us, if not all, have played with or at least seen LEGO blocks at some point in our lives. We typically associate LEGOs with building three-dimensional objects (think dinosaurs, space ships, and robots), but it turns out that LEGOs offer an extremely useful metaphor for drawing, too. And this LEGO metaphor will help us understand some key mechanisms behind how similar types of drawing work when we try to translate them to the internet.
To begin this metaphor, imagine you were given a limited set of LEGO blocks, like the following:
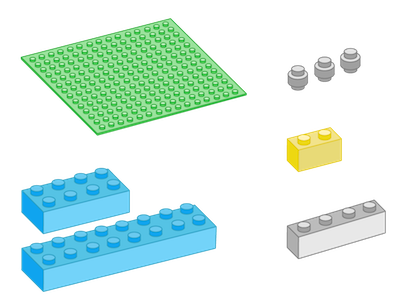
This set includes a baseplate (green, flate, square) and some blocks of assorted colors and sizes that we can place anywhere we want on the baseplate. Suppose you were to create a single-layered “drawing” with these blocks. The large green baseplate, 16 dots by 16 dots in size, is your drawing canvas. On top of this canvas, your drawing could be any combination of pieces, of any type, in any arrangement. For example, suppose that the drawing you created looked like this:
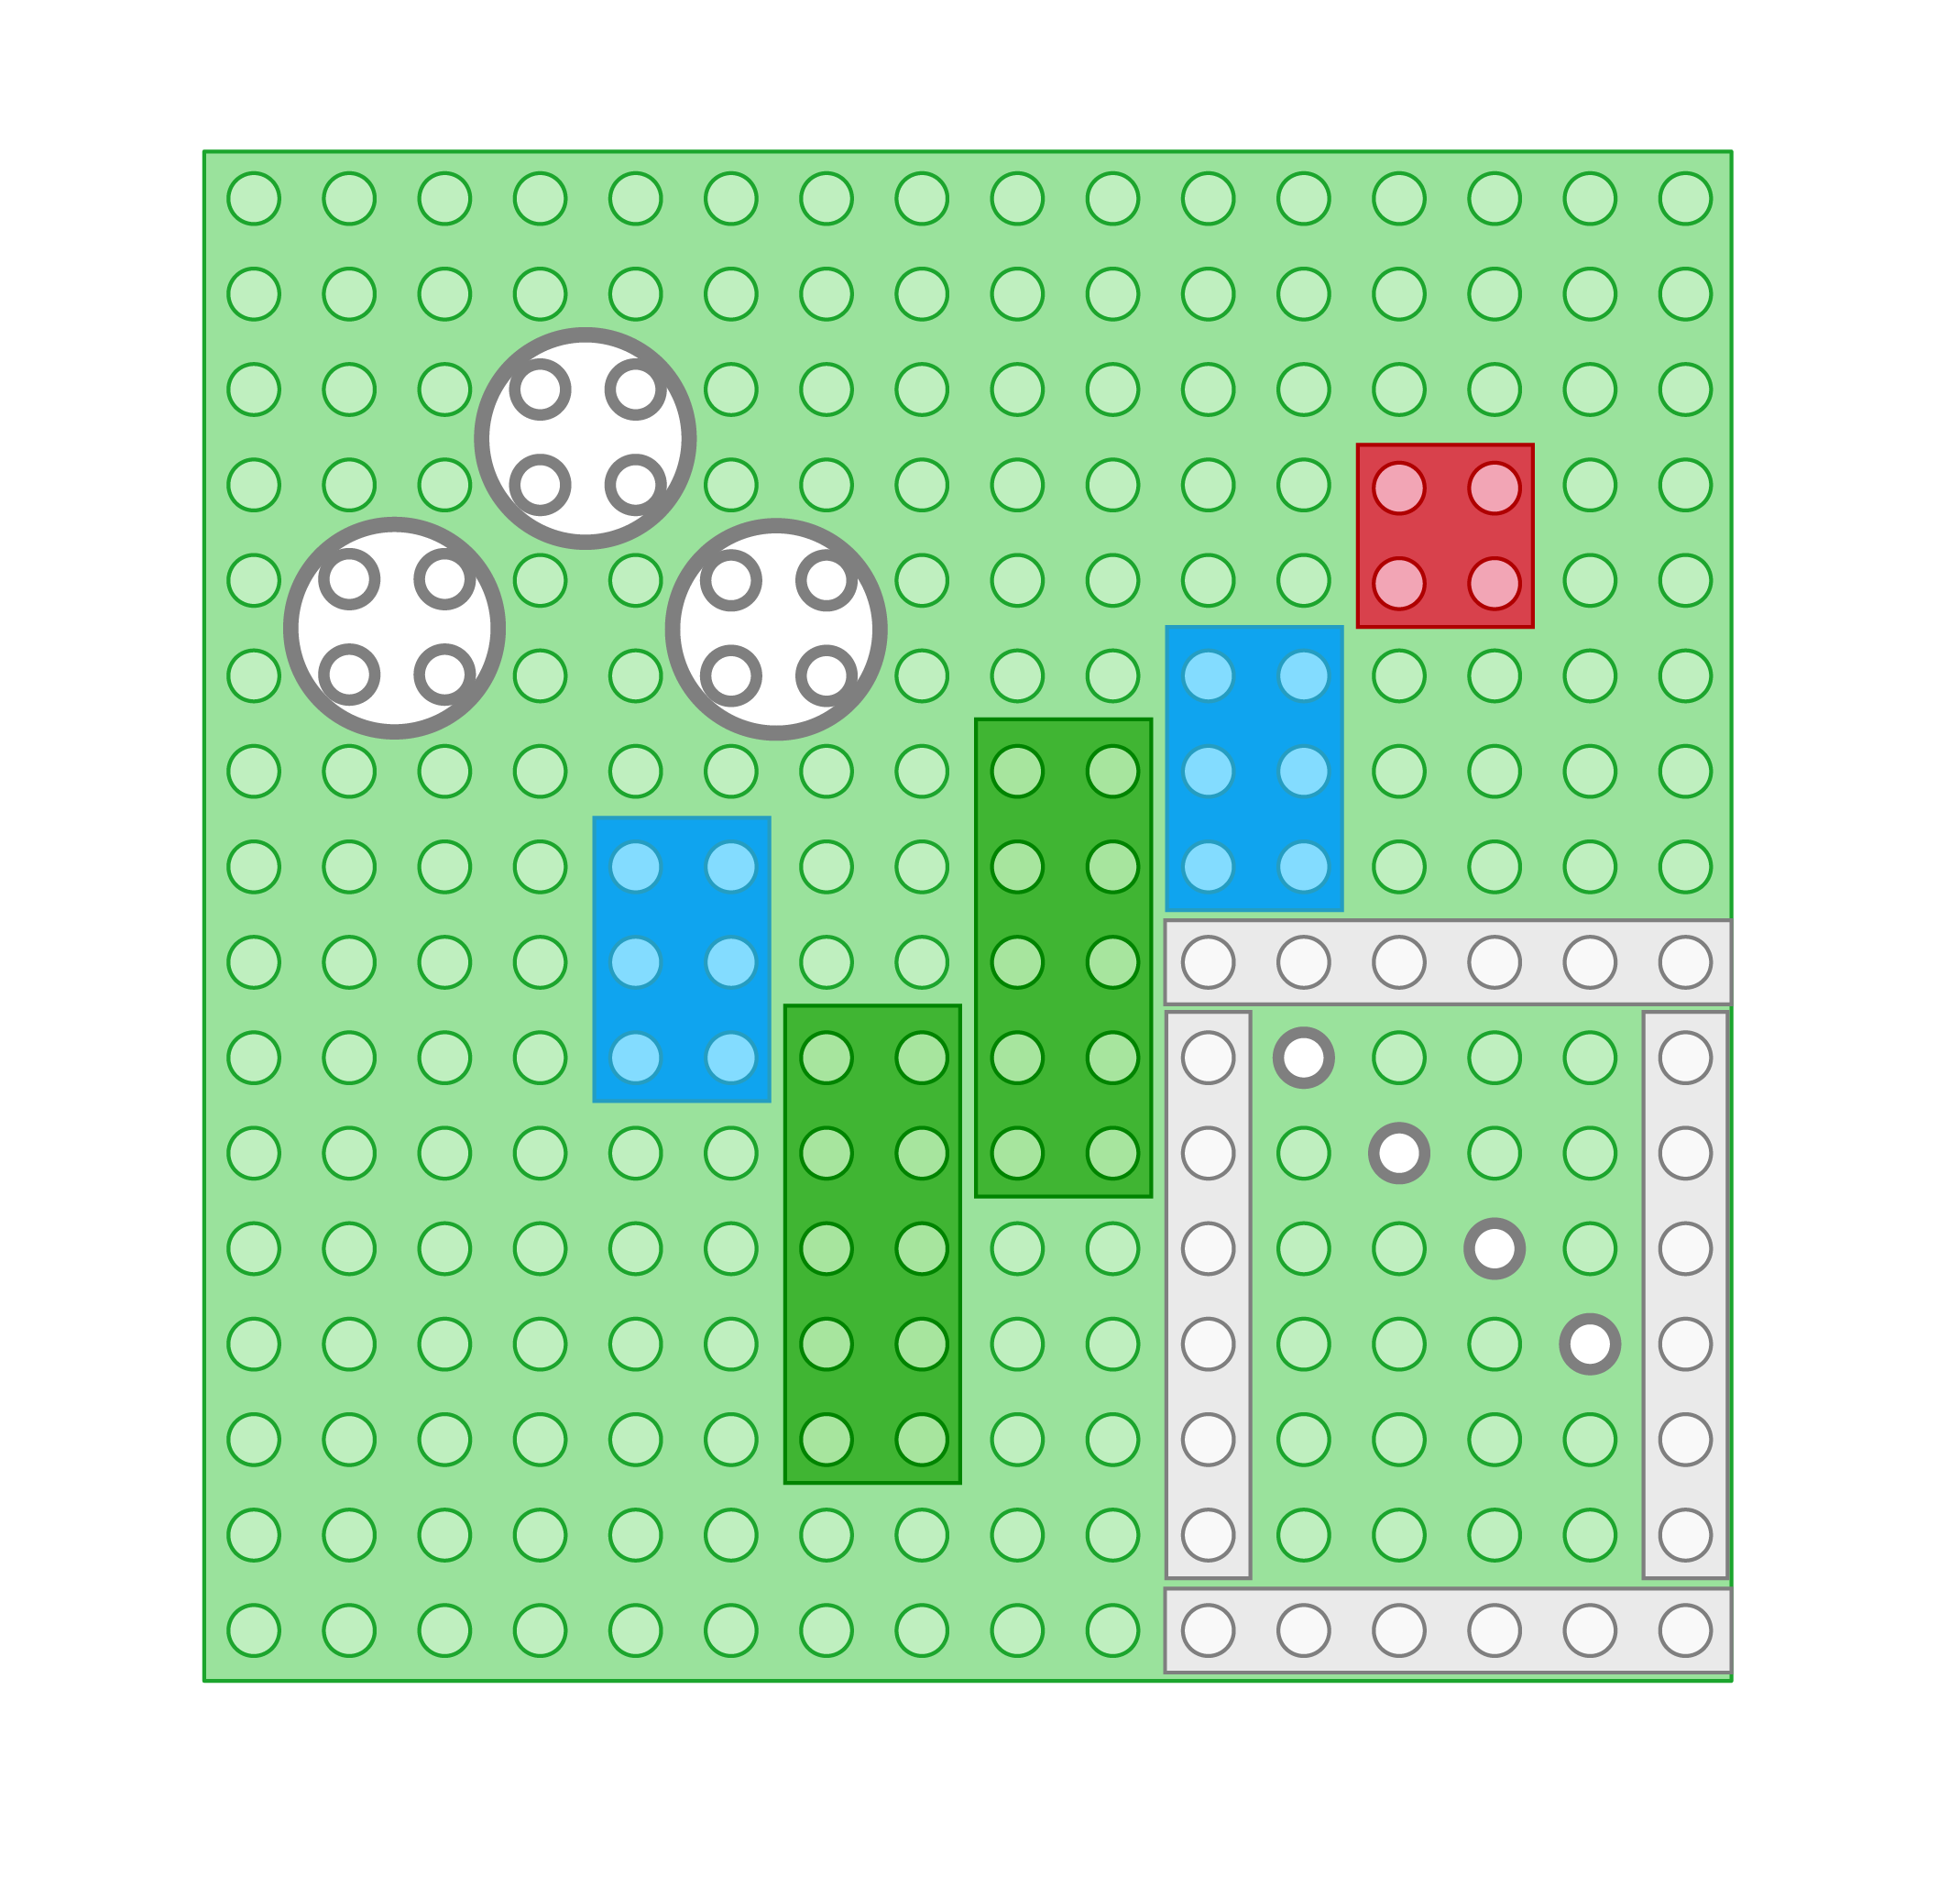
Try creating your own drawing with LEGO blocks. Use the following interactive canvas to draw your illustration. You can click a block on the right to select the type of block, and then click inside the canvas to place the block anywhere you want. The position of each block will automatically click into place when you click with the mouse. Blocks are assorted colors. You can rotate a piece by clicking the Rotate button (which will rotate your currently-selected block 90°), and you can clear the baseplate by clicking the Clear button.
After you are finished, examine your drawing and respond to the following questions.
- Based on the blocks in the drawing, what visual characteristics and properties are required to define and differentiate those blocks, what they look like, and where they are located, individually and in relation to one another? Be explicit. Do different blocks have different kinds of properties?
- Now imagine that you need to give a robot a set of instructions so that it can recreate your drawing above with LEGOs. To do so, you must give the robot a sequence of commands, each of which will tell the robot something specific to do, such as: “Move block [x number of places] to the right”. Come up with your sequence of commands, and be as specific as possible. What commands are needed to perfectly replicate your drawing?
- Reflect on how you constructed your commands from Question 2. From what part of the canvas do you dispatch your commands? (Bottom-left corner of the baseplate? Top-right corner of the baseplate? Somewhere in the middle?) How specific or explicit do your commands need to be? Does the order in which you dispatch your commands matter?
From LEGO to SVG
In the above exercise, you may have found yourself asking more questions than you might have expected. Things like reference point, position, and order of drawing are sometimes things we take for granted as being implicit and assumed. But just like what we saw with HTML, these things that we make assumptions about need to be explicitly stated for machines; the instructions that we provide, and the order in which we provide them, need to be excessive in their explanation.
This simulation using LEGO blocks is a useful metaphor for thinking about a new technology we will now throw into the mix of our journey through programming for the web: SVG. If you are already familiar with SVG, you may be wondering what physical LEGO blocks have to do with digital vector illustrations. Here, we will learn what SVG is and how it is used on the web, in the process dipping our toes for the first time in JavaScript and the JavaScript library D3.js to discover that the way we construct our LEGO drawings has a lot to say about how we can draw shapes through SVG and D3.
SVG essentials
SVG stands for scalable vector graphics, and it is used to draw graphics that can be displayed inside an HTML page. When we create SVG graphics, we are writing SVG code. This code has some important traits that overlap with what we’ve learned about HTML and CSS. Like HTML, SVG is a markup language and will be written in code much like how we write HTML (although SVG is a different type of markup language, specifically XML). Like CSS, it is a recommendation, or a collection of standards of how it should be written (and the expectation is that every piece of software that uses SVG follows these standards). Like both HTML and CSS, it is a versioned language that is maintained by the W3C. But unlike HTML and CSS, SVG gives us a powerful new ability that we haven’t seen yet – the ability to draw shapes!
SVG is used to make graphics, written in code with a text editor. When drawing in SVG, the only two things we need are an SVG canvas, on which we are able to draw, and a series of shapes, each of which has different visual attributes we define. For example, the following code draws a circle, inside of a drawing canvas that is 100 pixels wide by 100 pixels tall:
<svg width="100" height="100">
    <circle cx="50" cy="50" r="40" stroke="green" stroke-width="4" fill="yellow" />
</svg>
The code above produces the following output on the page:
Even though we haven’t seen SVG code before, parts of it should look familiar and perhaps even intuitive. For example, this code looks extremely similar to HTML, because we have tags (opening and closing) with names (like svg and circle) that tell us something about what content they are representing. In this case, the svg element produces a drawing canvas, inside of which our circle element can draw a circle that actually appears on the screen. (Both pieces are required in order to make this shape appear, because the tag name circle is only understood by the browser when we place it inside of an svg element!)
Additionally, inside these tags, we have many attributes defined, and although we haven’t seen these attributes in HTML, the names of the ones we see highlighted here are largely self-explanatory:
<svgwidth="100"height="100"> <circlecx="50"cy="50"r="40"stroke="green"stroke-width="4"fill="yellow" /> </svg>
This code allows us to do two things. First, it allows us to define different shapes – such as a circle – with any possible visual appearance we might want, including position, size, and color. Second, once we’ve defined those shapes, we can then draw them directly in an HTML document simply by placing our svg element anywhere inside the body of our HTML. This means that in addition to creating HTML pages with text and image content, we can also draw entire illustrations!
In essence, when we write SVG code, we are giving the computer instructions about what shapes to draw, where they should be located, and what they should look like. In the above example, we see a short list of instructions: "Make an SVG canvas, and inside of that, draw a circle, which should be located at the coordinates (50, 50), have a radius of 40 pixels, have a green outline of 4 pixels, and a fill color of yellow". These instructions are neatly packed within the syntax of the SVG code itself, although we may not yet fully understand how this is working behind the scenes.
Some important properties of SVG
To get a better understanding of what is in fact happening behind the scenes, let’s return to the LEGO drawing you created above. Reexamine what shapes you drew on the canvas, where they were positioned, how big they were, and what color they were. In the table below, you’ll find all of these data listed for each block you drew in the canvas above.
These data about things like shape type, color, position, and size aren’t merely characteristics of your blocks – they tell us much more about the identity of those blocks. For example, with the blocks available, there are only three kinds of shapes you were able to “draw” on your canvas: circles, rectangles (which includes squares), and lines (which are represented by the 1×2, 1×4, and 1×6 blocks). Depending on the type of shape, we can record different kinds of data about position (e.g., the start and end point of a line, versus the width and height of a rectangle). At the same time, there are other kinds of data that can be recorded for any shape, regardless of type, such as color.
These observations about our LEGOs translate directly to SVG. In fact, the way that we made our "drawing" with LEGOs is a metaphor for the exact same kinds of operations we perform when drawing in SVG, except with fewer degrees of freedom in terms of where we can place our shapes and what they look like. Just like with LEGOs, we will position shapes in SVG relative to a canvas that constrains where they can be located; likewise, just like with LEGOs, we will be limited in the number of different types of shapes we can draw in SVG. Those shapes may be different in visual appearance in terms of aesthetics like size and color, but ultimately, we will be required to make any drawing we want to make with the building blocks (or graphical primitives) we are given.
SVG is a complex topic, but for our purposes, we will care the most about the following features of SVG in particular:
- In SVG, there is a limited number of shape types we can draw, including circles, lines, rectangles, path elements, and text elements; these are the primitive shapes from which we can create any kind of vector-based illustration.
- Any shapes we draw will be drawn relative to the top-left corner of the SVG canvas; information about the position of a shape will always be defined relative to this origin.
- The order in which we draw shapes matters; shapes that we draw before other shapes will be layered or overlapping, depending on the order in which we draw those specific shapes.
- Different shape types have different possible attributes. Some attributes are required to make a shape visible on the screen, depending on the type of shape. Other attributes are optional, but provide additional information about how the shape should be displayed.
In the LEGO example, the data about position, size, color, etc. are all attributes of those shapes. These are what give our illustration its expressive potential. What we call "attributes" in SVG will be extremely similar in concept to what we call "style properties" in CSS, because there will be a limited number of recognized names for attributes, and those attributes will only be able to accept certain kinds of values. But with some creativity, we will find that an infinite range of possible combinations of values for attributes like size, color, and location will yield a canvas that can display an infinite number of creative possibilities.
Most of the time, we'll be landing somewhere in the middle, between extremely simple and infinitely complex, such as the following illustration (and even this is closer to the "complex" end of the spectrum):

But as soon as our illustrations become even a little bit more complex, our SVG has to grow longer and longer to capture all of the specific instructions about how to draw that illustration. For example, the following is a tiny snippet of the code required to make the above illustration possible:
<svg
xmlns:dc="http://purl.org/dc/elements/1.1/"
xmlns:cc="http://creativecommons.org/ns#"
xmlns:rdf="http://www.w3.org/1999/02/22-rdf-syntax-ns#"
xmlns:svg="http://www.w3.org/2000/svg"
xmlns="http://www.w3.org/2000/svg"
xmlns:xlink="http://www.w3.org/1999/xlink"
width="50"
height="50"
viewBox="0 0 94.487725 108.03812">
<defs
id="defs4">
<pattern
xlink:href="#Polkadots-large"
id="pattern6035"
patternTransform="matrix(0.80761191,0,0,1.0348962,-15.845548,1037.5094)" />
<pattern
id="Polkadots-large"
patternTransform="translate(0,0) scale(10,10)"
height="10"
width="10"
patternUnits="userSpaceOnUse">
<circle
id="circle5725"
r="0.45"
cy="0.810"
cx="2.567"
style="fill:black;stroke:none" />
<circle
id="circle5727"
r="0.45"
cy="2.33"
cx="3.048"
style="fill:black;stroke:none" />
<circle
id="circle5729"
r="0.45"
cy="2.415"
cx="4.418"
style="fill:black;stroke:none" />
<circle
id="circle5731"
r="0.45"
cy="3.029"
cx="1.844"
style="fill:black;stroke:none" />
<circle
id="circle5733"
r="0.45"
cy="1.363"
cx="6.08"
style="fill:black;stroke:none" />
<circle
id="circle5735"
r="0.45"
cy="4.413"
cx="5.819"
style="fill:black;stroke:none" />
<circle
id="circle5737"
r="0.45"
cy="4.048"
cx="4.305"
style="fill:black;stroke:none" />
...
(You might be surprised to know that this SVG code is exactly the same kind of SVG code that vector illustration tools like Adobe Illustrator use. Whenever you create a drawing in Illustrator, what you are really doing is writing SVG code, but indirectly through the graphical interface of the software itself; the software translates your mouse movements and appearance properties into SVG. You can confirm this for yourself by making a drawing in Illustrator, saving the file as an SVG file, and then opening the resulting file in Visual Studio Code.)
As you might imagine, this can get really tedious really quickly. In our creative coding for the web, we will want to draw shapes on the screen, but we won’t ever want to write out all of this SVG by hand. Nor will we ever need to. Instead, we can make light work of drawing shapes, from simple to complex, with the help of another tool for writing code. That tool is D3.
D3 is a JavaScript library that helps us draw shapes
In future units, we will spend a lot of time learning more about D3, but here, we will simply get our first exposure to it. D3 is what we call a JavaScript library; it is a collection of functions that translate more complex operations in the JavaScript language into a “D3 language” that is more readable and easier to work with. In other words, it allows us to write less code to do things that ordinarily would take a lot more complicated code if it were written in plain JavaScript. (We will learn what we mean by "plain JavaScript" in the weeks to come.) This translation turns out to be extremely useful when it comes to drawing SVG shapes, because we can tell D3 what shapes we want to draw, and D3 will handle all the translation work to turn our instructions into complete SVG markup before inserting that markup into the HTML. This will be one of our primary motivations for using D3 this semester.
Let's return to our simple circle example from above. Recall that the complete SVG markup for this shape looks like the following:
<svg width="100" height="100">
    <circle cx="50" cy="50" r="40" stroke="green" stroke-width="4" fill="yellow" />
</svg>
If we wanted to draw this same shape, but using D3 to handle the work for us, we would write the following in the D3 language:
d3.select("svg")
    .append("circle")
    .attr("cx", 50)
    .attr("cy", 50)
    .attr("r", 40)
    .attr("stroke", "green")
    .attr("stroke-width", 4)
    .attr("fill", "yellow");
We will learn more about what is happening in the code above in the coming weeks; we don't need to worry about the mechanics right now. But for the time being, notice one thing in particular. There is a direct parallelism between the names and values of the attributes in the SVG markup and the D3 code. Can you spot them?
In this process of drawing our circle using D3, we have simply taken the same visual appearance attributes of our circle from the raw SVG markup and placed those attributes into a structure that D3 understands. For any kind of SVG shape we want to draw, we can follow the same kind of procedure to create them through D3. When the browser sees the code above, it knows (with the help of D3) to convert that code directly into SVG markup, which the browser is then able to successfully interpret to produce the circle we see on the screen.
We will soon learn how to draw any kind of SVG shape (circle, line, rectangle) with some basic patterns of D3 code. For now, let's wrap up by doing some exploration of an illustration made with D3 code.
Exploration
Examine the code file provided. This file includes D3 code that produces a simple illustration of a house, constructed from various kinds of shapes: rectangles, circles, and lines. Open this file in Visual Studio Code, and also open it as a web page in Chrome. You should see an illustration rendered in Chrome.
We won't know anything about what this code is doing yet – that's okay! But that doesn't mean we can't manipulate the code to see what happens. Notice that on most of these lines, we have some code that says .attr( ), inside of which we have a name of an attribute (like cx, r, width, and fill), followed by a comma, followed by a value of some kind. Play around with the values of the attributes for various shapes, based on what your best guess is for what kinds of values can be specified. Some of these attributes take values that are numbers, and some take attributes that are words; some of these attributes take values that are written with quotation marks, and others take attributes that are written without quotation marks. Pay attention to these differences, and try to swap in and out similar kinds of values, based on how they are written.
Try changing the values in at least 5 different places, anywhere in the document that corresponds to what looks like the name of an attribute. For each value you change, describe the following:
- The name of the attribute you changed (the first word in quotation marks inside of the
.attr( )code; for example, in.attr("fill","yellow"), the name of the attribute would be "fill") - What you changed the value to
- What you noticed happened to a specific shape in the illustration. When you change a value, save the file, and then refresh the page in Chrome, what looks different? Be specific.